|
For the production of movies for the Adler planetarium Chicago we were
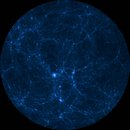
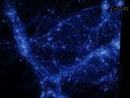
rerunning the Box 64 - 10909 simulation (dark matter only) on the pleiades computer of NAS Ames. For this special purpose 7200 outputs in equal distance delta_a_expn = 0.0001362 were stored. The movie shows the evolution of the Local Group in spherical projection.
Credit: CLUES team and C. Henze, N. McCurdy, J. Primack
Fast preview movie [avi, 1024x1024, 4.4 MB]
Full resolution [mpg, 1024x1024, 134 MB]
Lower quality [mp4, 1024x1024, 23 MB]
Snapshot [jpg, 1024x1024, 109 KB]
|
|
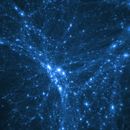
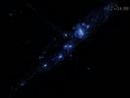
Same as above, but no spherical projection. At the end of evolution the camera zooms inward and the Local Group, Virgo Cluster and Fornax are labeled.
Credit: CLUES team and C. Henze, N. McCurdy, J. Primack
Fast preview movie [avi, 1024x1024, 9.3 MB]
Full resolution [mp4, 1024x1024, 345 MB]
Full resolution [webm, 1024x1024, 25 MB]
Medium resolution [mp4, 640x640, 113 MB]
Low resolution [mp4, 320x320, 29 MB]
Snapshot [jpg, 1024x1024, 113 KB]
|
|
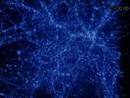
Flight through the whole simulation box, WMAP5 (dark matter only, Box 64 - 10909. Visualized using pgplot.
Credit: G. Yepes and the CLUES team
[avi, 1520x1142, 17 MB]
|
|
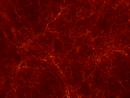
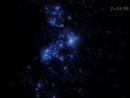
Evolution of Andromeda (center), Milky Way (upper right) and M33 (lower right) in a ~ 2 Mpc/h box (Box 64 - 186592), starting at redshift z=42. The colours represent the dark matter density. A similar movie for the gas density evolution can be found in the Gas-section. Visualized using
PMViewer.
Credit: K. Riebe and the CLUES team
[avi, 1024x768, 27 MB]
|
|
Evolution of Milky Way and Andromeda Galaxy (M31) in a 1.5 Mpc box (Box 64 - 10909). Visualized using pgplot.
Credit: G. Yepes and the CLUES team
[avi, 1520x1140, 19 MB]
|
|
Evolution of M31 in a 250 kpc box (Box 64 - 10909). Visualized using pgplot.
Credit: G. Yepes and the CLUES team
[avi, 1520x1142, 19 MB]
|
|
Evolution of the Milky Way in a 250 kpc box (Box 64 - 10909). Visualized using pgplot.
Credit: G. Yepes and the CLUES team
[avi, 1520x1142, 19 MB]
|
|
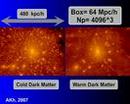
A comparison between cold and warm dark matter, Box 64 - 186592. Visualized using PMViewer.
Credit: A. Khalatyan and the CLUES team
[avi, 720x576, 8.8 MB]
|
|
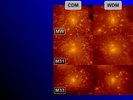
Comparison between cold and warm dark matter for the three main halos of the Local Group, Box 64 - 186592. Visualized using PMViewer.
Credit: A. Khalatyan and the CLUES team
[avi, 640x480, 2.3 MB]
|

|
Comparison of dark matter (left) and gas (right) density distribution of the Local Group at z=0 (Box 64 - 186592, 2048^3
particles effective resolution). Visualized using PMViewer.
Credit: K. Riebe and the CLUES team
[avi, 1220x610, 38 MB]
[avi, 1024x512, 38 MB]
|
|
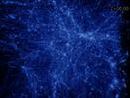
A flight through the whole simulation box (dark matter distribution), Box 64 - 186592. Visualized using pgplot.
Credit: G. Yepes and the CLUES team
[avi, 1520x1142, 16 MB]
|