
Dark Matter
These pictures show the large scale dark matter distribution and a selection of dark matter halos from our simulations.
The brightness of colors indicates the density, if not stated otherwise.
Copyright [if not stated otherwise]: S. Gottlöber, G. Yepes, A. Klypin, A. Khalatyan
Images
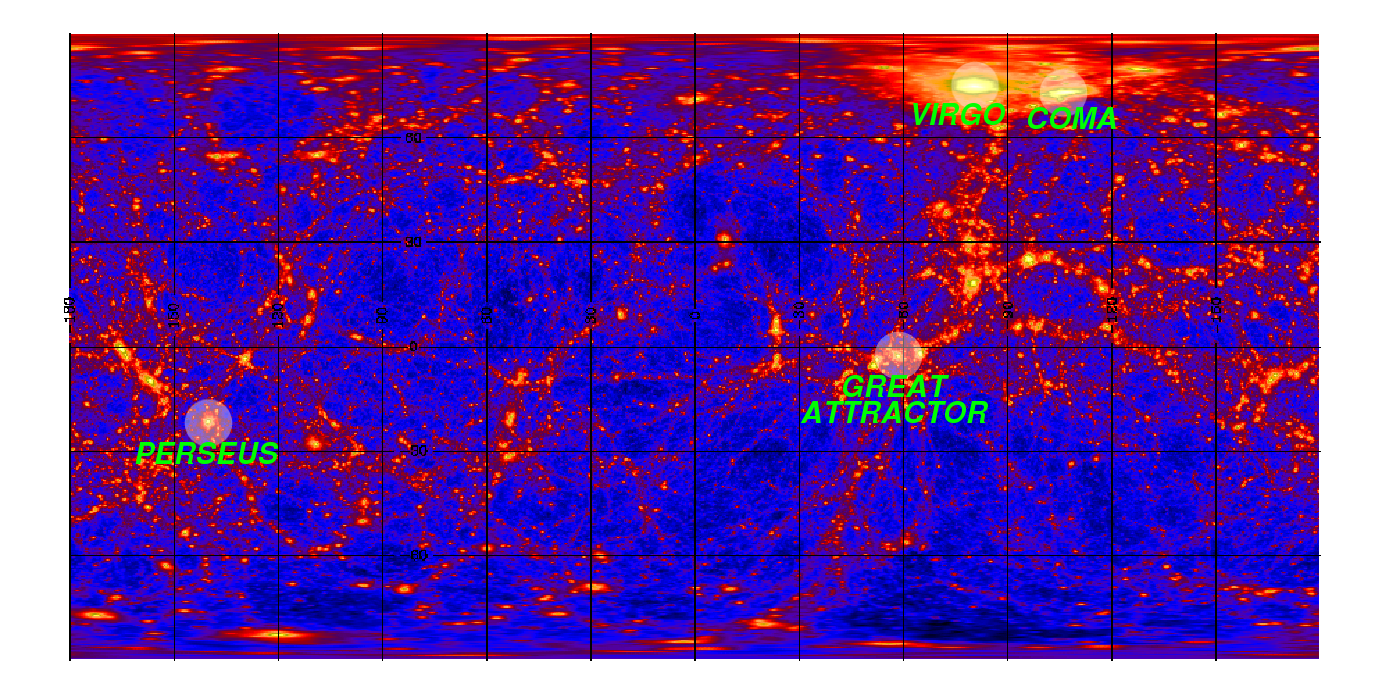 |
All-sky map of the gamma-ray flux from dark matter decay in Cartesian projection using galactic coordinates. This flux is assumed to be proportional to the dark matter density in the constrained cosmological simulation Box 160. Known observed large structures reproduced by this simulation such as Virgo, Coma, and Perseus clusters, together with the Great Attractor, are labeled in this plot. (A.J. Vazquez, F. Prada, F. Zandanel; Image generated with HEALPix, see K.M. Gorski et al., 2005 for details) with labels [png, 1389×694, 812 KB] |
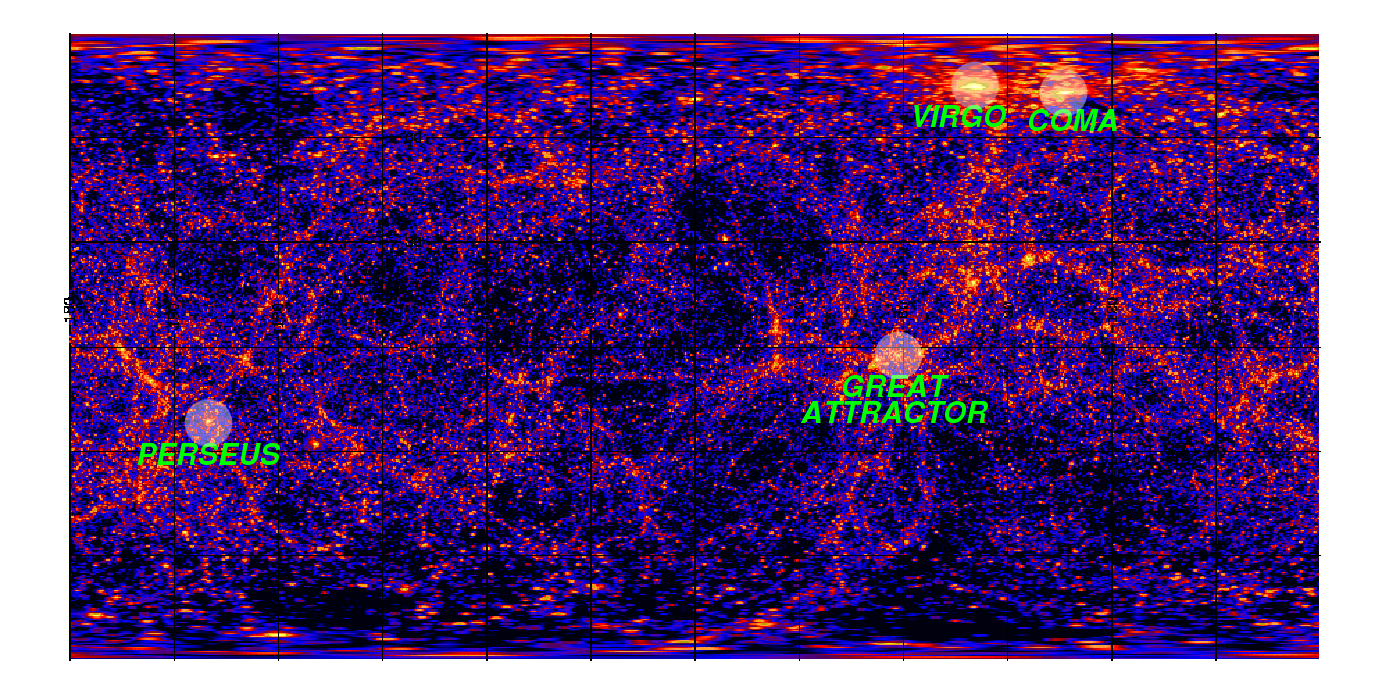 |
Another all-sky map, this time of the gamma-ray flux from dark matter annihilation. The flux is assumed to be proportional to the dark matter density squared in the constrained cosmological simulation Box 160. Again labels show the known observed large scale structured of the Local Universe. (A.J. Vazquez, F. Prada, F. Zandanel; Image generated with HEALPix, see K.M. Gorski et al., 2005, for details) with labels [png, 1389×694, 827 KB] |
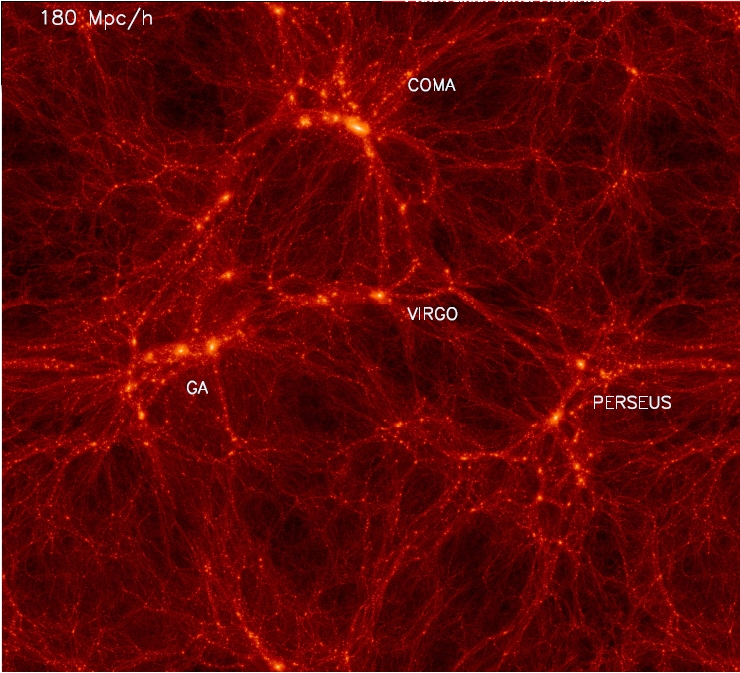 |
Large scale dark matter density distribution of the Local Universe (Box 160). The image shows a slice through the center of the box and its boundary is periodically wrapped to get a side length of 180 Mpc/h. Also see Anatoly Klypin – Box 160.
|
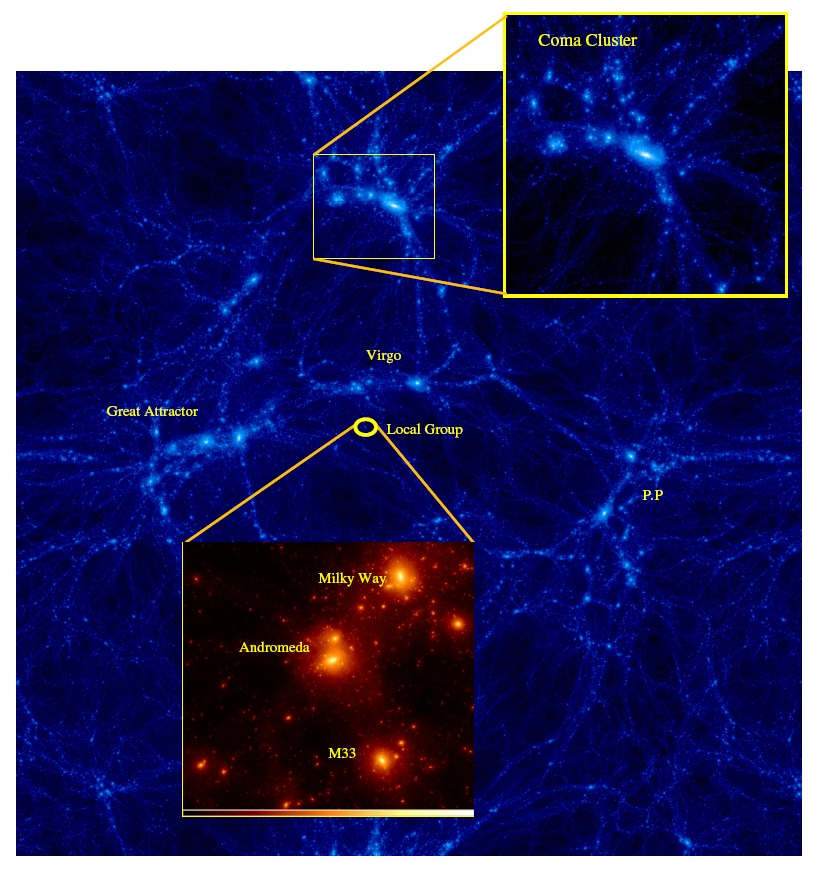 |
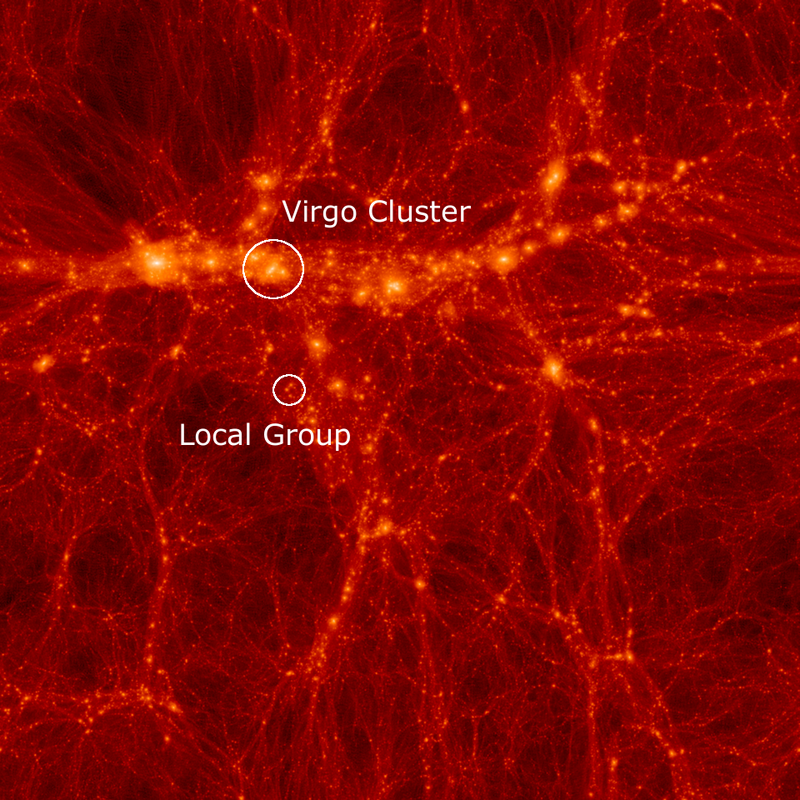
Large scale dark matter density distribution of the Local Universe simulation (Box 160). The image covers the full box range of 160 Mpc/h. Several objects of the real universe are identified: the circle shows the position of our Local Group, a blown up panel shows the detailed structure of the simulated Local Group. The resolution of this small region of 2 Mpc/h radius is equivalent to having a total of 4096^3 (70 billion) particles in the whole box, which translates in a dynamical range of more than 106. |
 |
Dark matter distribution in the 64 Mpc/h box (Box 64-186592).
with labels [png, 800×800, 708 KB]
medium [png, 800×800, 694 KB] large [png, 1024×1024, 1.1 MB] huge [png, 8000×8000, 28 MB] |
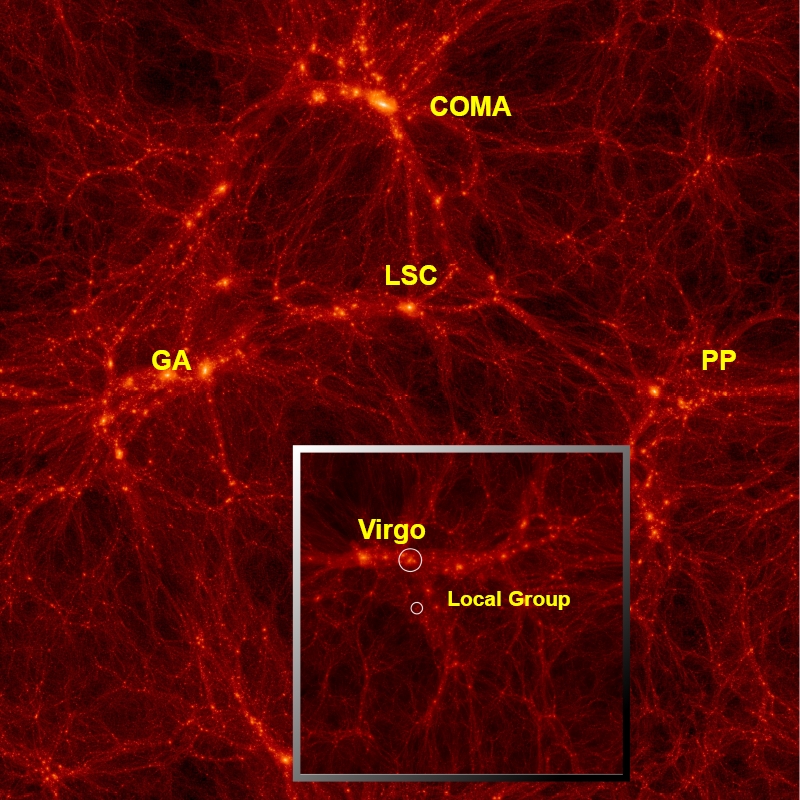 |
A combination of two slices from two different CLUES simulations within a WMAP 3 cosmology: Box 160 and Box 64-186592 (inset panel). The Local Supercluster (LSC) forms in both simulations and matches pretty well, despite the fact that the realizations were different. LSC = Local Supercluster GA = Great Attractor PP = Perseus-Pisces-Cluster |
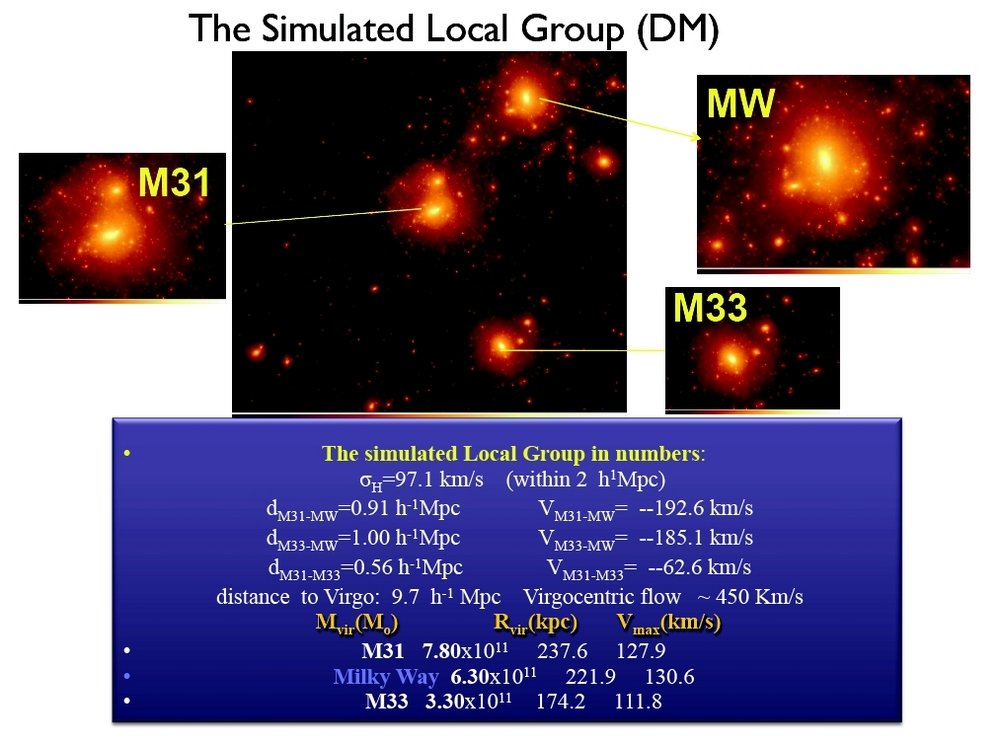 |
Andromeda Galaxy (centre), Milky Way and Triangulum Galaxy in the high resolution region (2 Mpc/h) of Box 64-186592 plus some additional information. |
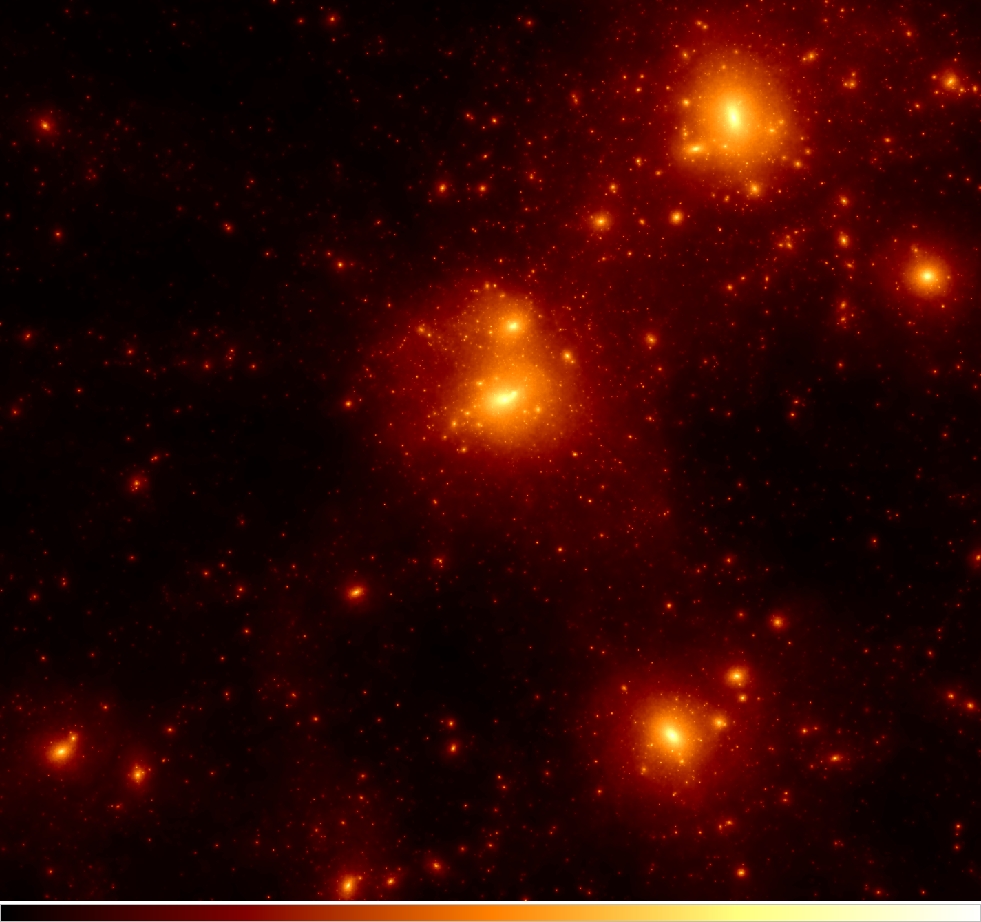 |
Andromeda Galaxy (centre), the Milky Way and Triangulum Galaxy in the high resolution region (2 Mpc/h). |
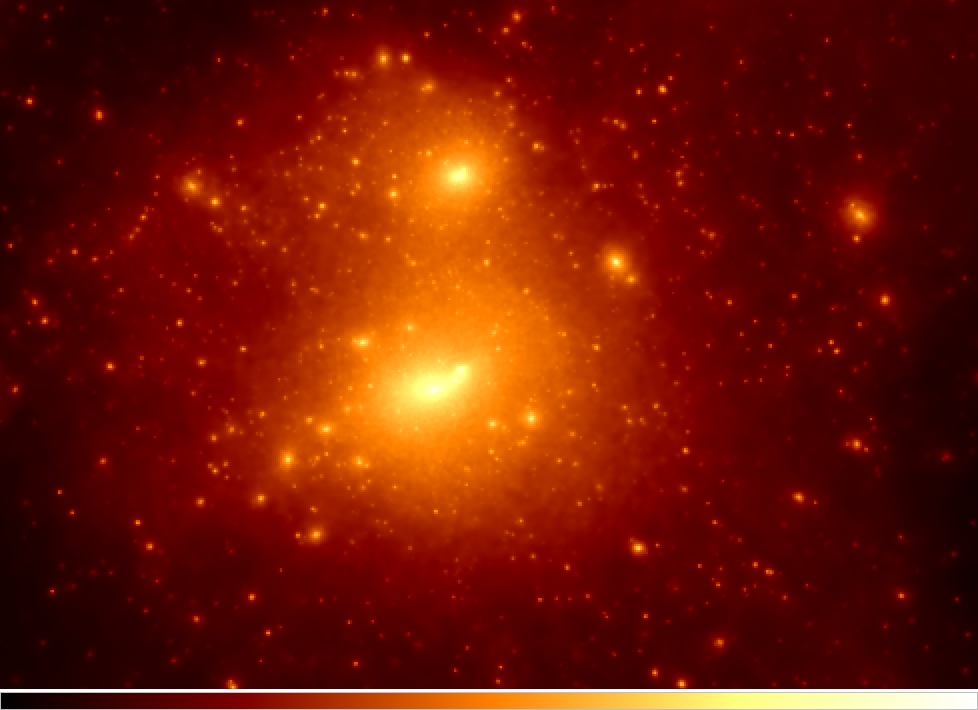 |
Andromeda Galaxy |
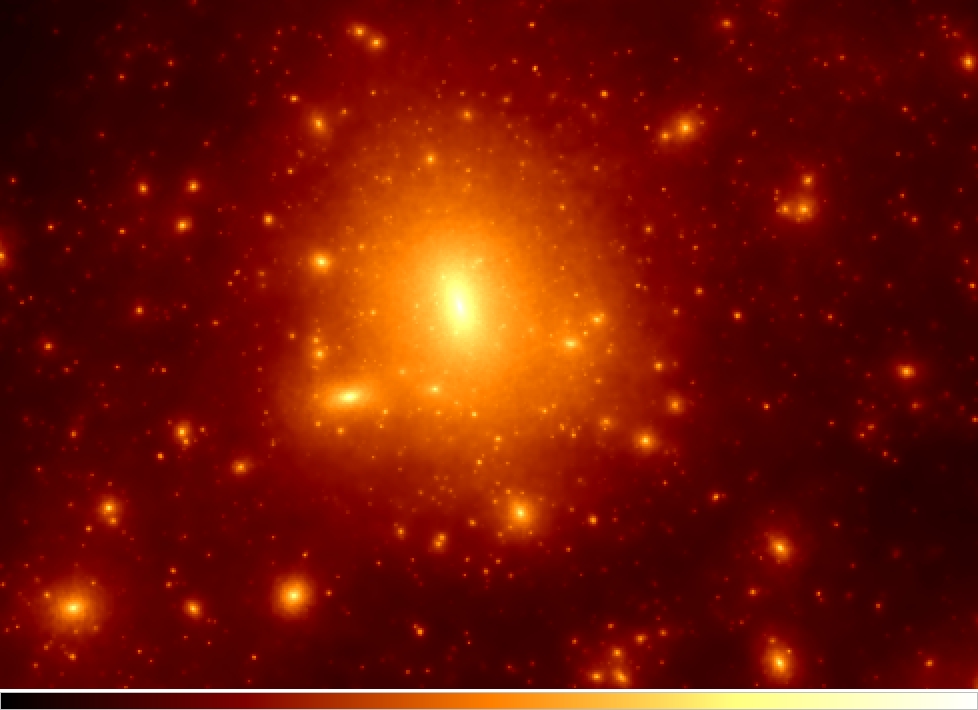 |
Milky Way |
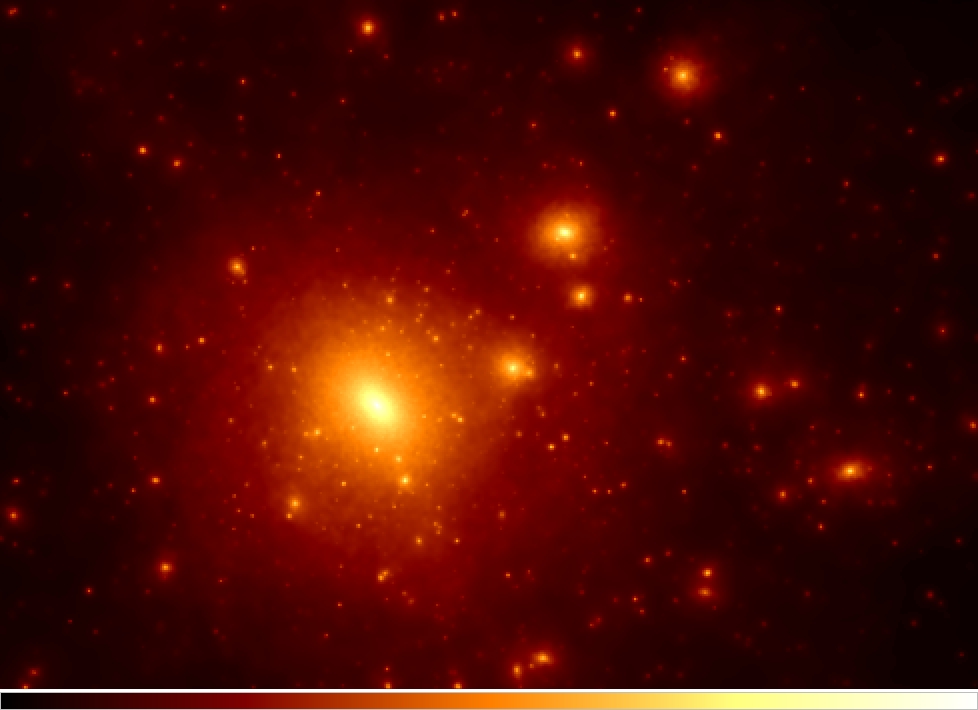 |
Triangulum galaxy (M33) |
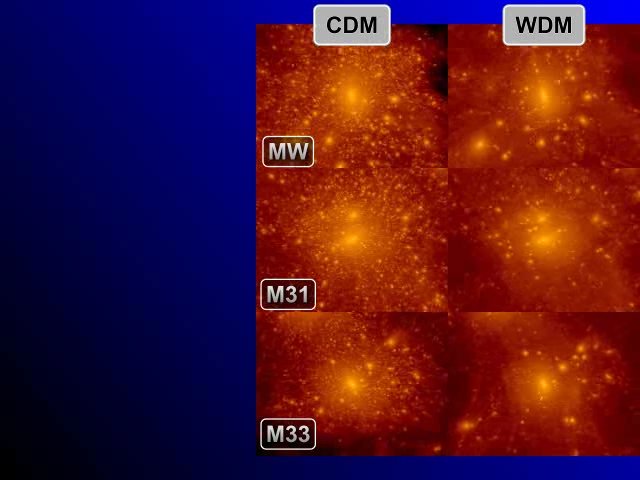 |
Comparison of the three main halos in the Cold and Warm Dark Matter simulation.
(also see Movies)
|
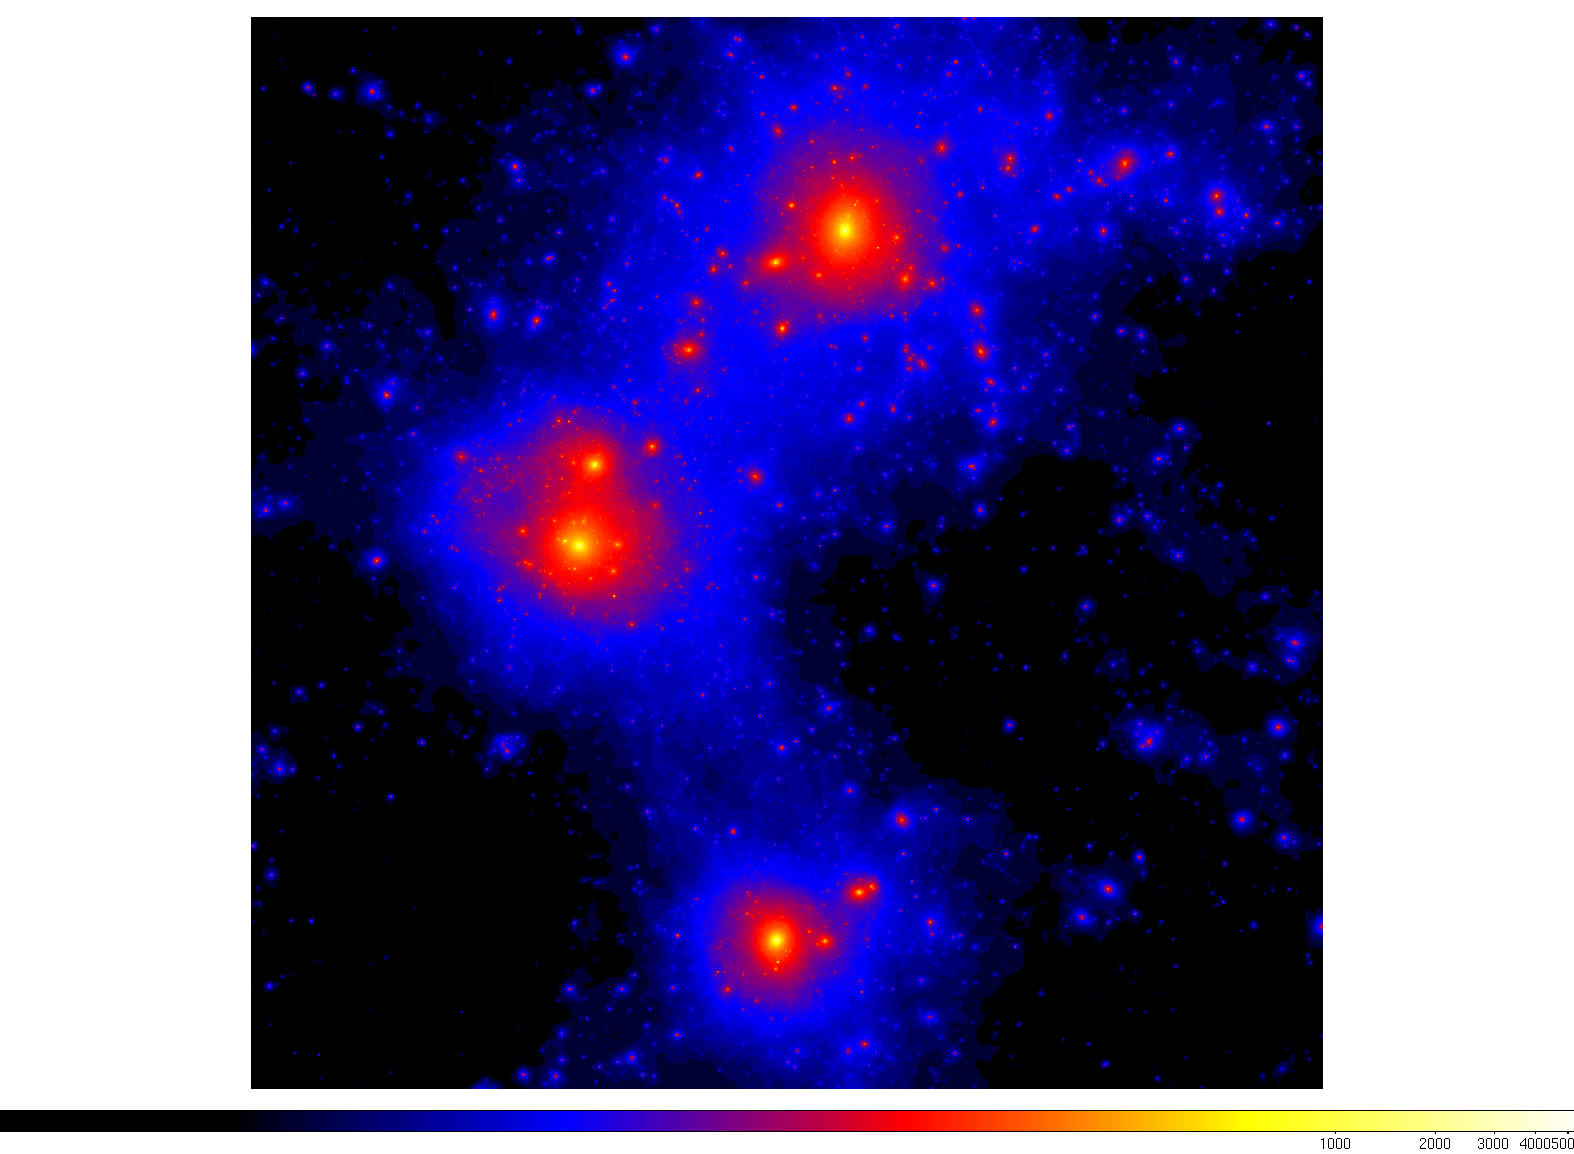 |
Projection of the three main halos (MW, M31, M33) along the z-direction (Box 64-186592). The presented image has a size of 1.3 Mpc/h per side.
Versions with gas and star distribution are available at: |
![[png, 1389×694, 738 KB]](/misc/images/darkmatter/Box160AllSkyDMDecay_nolabel.png)
![[png, 1389×694, 827 KB]](/misc/images/darkmatter/Box160AllSkyDMAnnihil.png)
![[png, 1389×694, 748 KB]](/misc/images/darkmatter/Box160AllSkyDMAnnihil_nolabel.png)
![[jpg, 740×673, 430 KB]](/misc/images/darkmatter/localgroup-180Mpc.jpg)
![[jpg, 820×873, 533 KB]](/misc/images/darkmatter/Box160_64CDM.jpg)
![[png, 800×800, 708 KB]](/misc/images/darkmatter/slice_box64-medium-labels.png)
![[png, 800×800, 694 KB]](/misc/images/darkmatter/slicefromZbuffer_box64_2-medium.png)
![[png, 1024×1024, 1.1 MB]](/misc/images/darkmatter/slicefromZbuffer_box64_2-high.png)
![[png, 8000×8000, 28 MB]](/misc/images/darkmatter/slicefromZbuffer_box64_2.png)
![[png, 800×800, 543 KB]](/misc/images/darkmatter/Box160and64.jpg)
![[jpg, 1000×745, 105 KB]](/misc/images/darkmatter/Simulated_LG-1_info.jpg)
![[jpg, 981×922, 445 KB]](/misc/images/darkmatter/yaniv4096.jpg)
![[jpg, 978×710, 260 KB]](/misc/images/darkmatter/yaniv4096_M31.jpg)
![[jpg, 978×710, 265 KB]](/misc/images/darkmatter/yaniv4096_MW.jpg)
![[jpg, 978×710, 209 KB]](/misc/images/darkmatter/yaniv4096_M33.jpg)
![[jpg, 640×480, 36 KB]](/misc/images/darkmatter/LG_CDMvsWDM.avi.jpg)
![[png, 1574×1154, 503 KB]](/misc/images/darkmatter/LG_dm.png)
![gas [png, 1574×1154, 357 KB]](/misc/images/gas/LG_gas.png)
![stars [png, 1574×1154, 22 KB]](/misc/images/stellardisk/LG_stars.png)
Movies
All movies were created by simulations of the CLUES team (PI’s: S. Gottlöber, Y. Hoffman, A. Klypin, G. Yepes). The simulations have been performed at LRZ Munich, NIC Jülich and BSC Barcelona and are described in the simulations section
| For the production of movies for the Adler planetarium Chicago we were rerunning the Box 64 – 10909 simulation (dark matter only) on the pleiades computer of NAS Ames. For this special purpose 7200 outputs in equal distance delta_a_expn = 0.0001362 were stored. The movie shows the evolution of the Local Group in spherical projection. Credit: C. Henze, N. McCurdy, J. Primack and CLUES team. Fast preview movie (4x speed) [avi, 1024×1024, 22 MB] Fast preview movie (4x speed) [mp4, 1024×1024, 23 MB] Lower quality, small [mp4, 640×640, 23 MB] Lower quality [mp4, 1024×1024, 45 MB] Full resolution [mpg, 1024×1024, 134 MB] Snapshot [jpg, 1024×1024, 109 KB] |
|
| Same as above, but no spherical projection. At the end of evolution the camera zooms inward and the Local Group, Virgo Cluster and Fornax are labeled. Credit: C. Henze, N. McCurdy, J. Primack and CLUES team. Fast preview movie (4x speed) [avi, 1024×1024, 9.3 MB] Fast preview movie (4x speed) [mp4, 1024×1024, 13 MB] Low quality [mp4, 1024×1024, 50 MB] Small size, full quality [mp4, 640×640, 113 MB] Full size, full quality [mp4, 1024×1024, 345 MB] Snapshot [jpg, 1024×1024, 113 KB] |
|
| Flight through the whole simulation box, WMAP5 (dark matter only, Box 64 – 10909. Visualized using pgplot. Credit: G. Yepes and the CLUES team |
|
| Evolution of Andromeda (center), Milky Way (upper right) and M33 (lower right) in a ~ 2 Mpc/h box (Box 64 – 186592), starting at redshift z=42. The colours represent the dark matter density. A similar movie for the gas density evolution can be found in the Gas-section. Visualized using PMViewer. Credit: K. Riebe and the CLUES team |
|
| Evolution of Milky Way and Andromeda Galaxy (M31) in a 1.5 Mpc box (Box 64 – 10909). Visualized using pgplot. Credit: G. Yepes and the CLUES team |
|
| Evolution of M31 in a 250 kpc box (Box 64 – 10909). Visualized using pgplot. Credit: G. Yepes and the CLUES team |
|
| Evolution of the Milky Way in a 250 kpc box (Box 64 – 10909). Visualized using pgplot. Credit: G. Yepes and the CLUES team |
|
| A comparison between cold and warm dark matter, Box 64 – 186592. Visualized using PMViewer. Credit: A. Khalatyan and the CLUES team |
|
| Comparison between cold and warm dark matter for the three main halos of the Local Group, Box 64 – 186592. Visualized using PMViewer. Credit: A. Khalatyan and the CLUES team |
|
| Comparison of dark matter (left) and gas (right) density distribution of the Local Group at z=0 (Box 64 – 186592, 2048^3 particles effective resolution). Visualized using PMViewer. Credit: K. Riebe and the CLUES team [avi, 1220×610, 38 MB] |
|
| A flight through the whole simulation box (dark matter distribution), Box 64 – 186592. Visualized using pgplot. Credit: G. Yepes and the CLUES team |